ScalewaySkip to loginSkip to main contentSkip to footer section

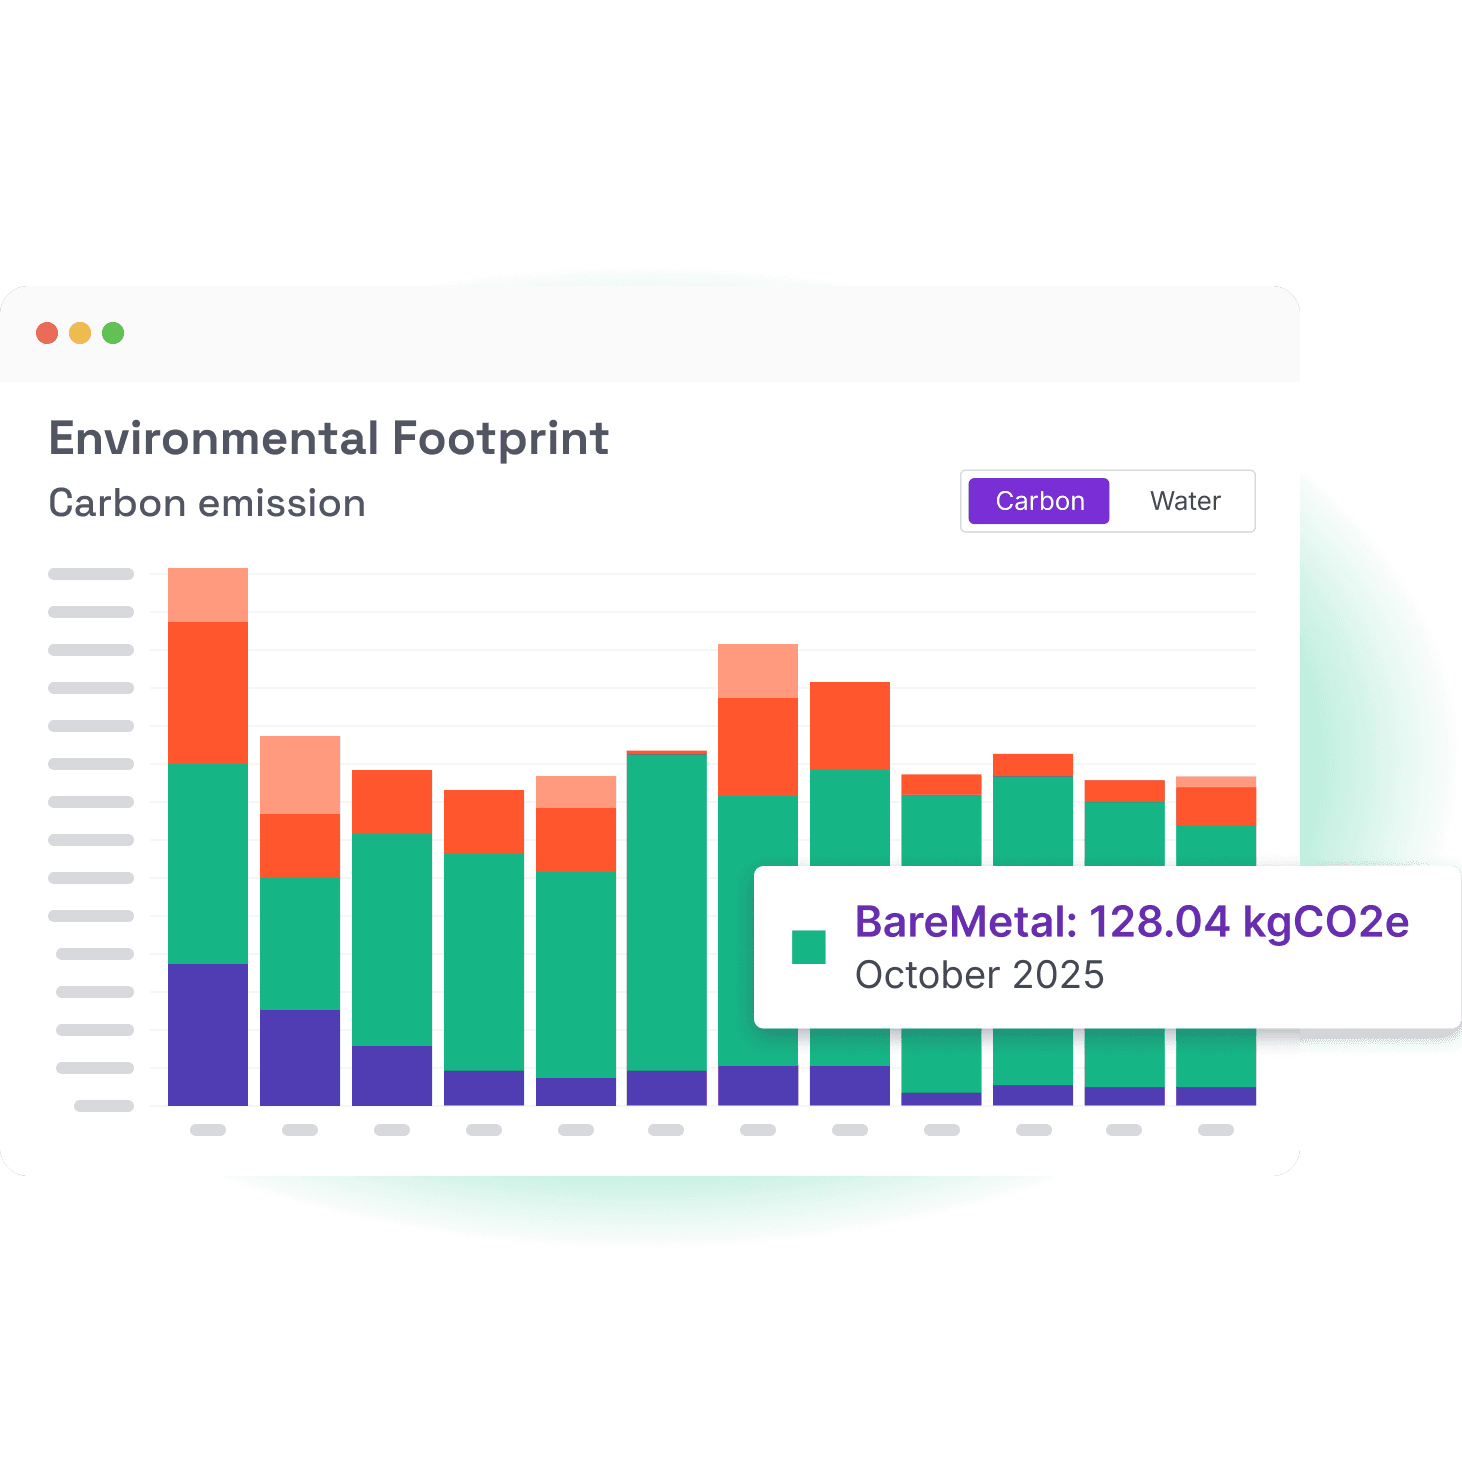
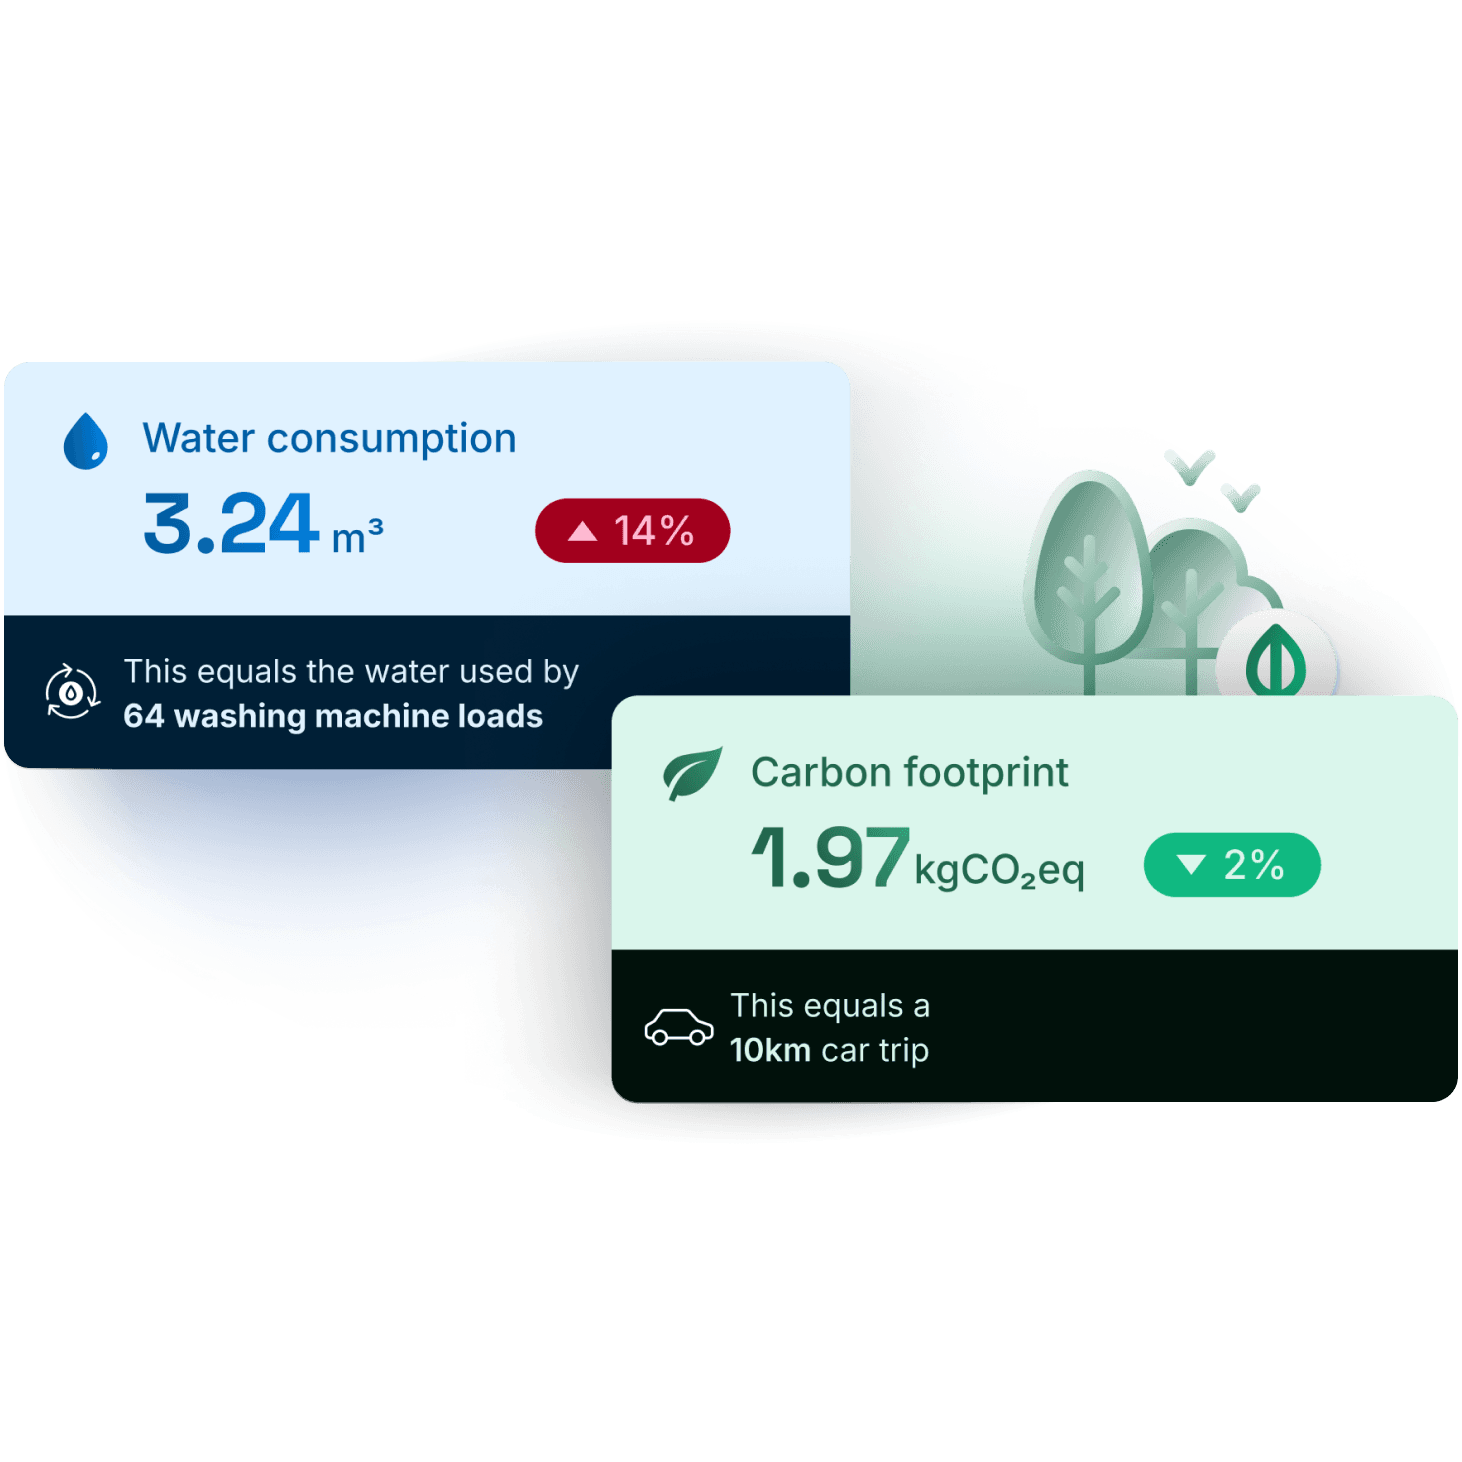
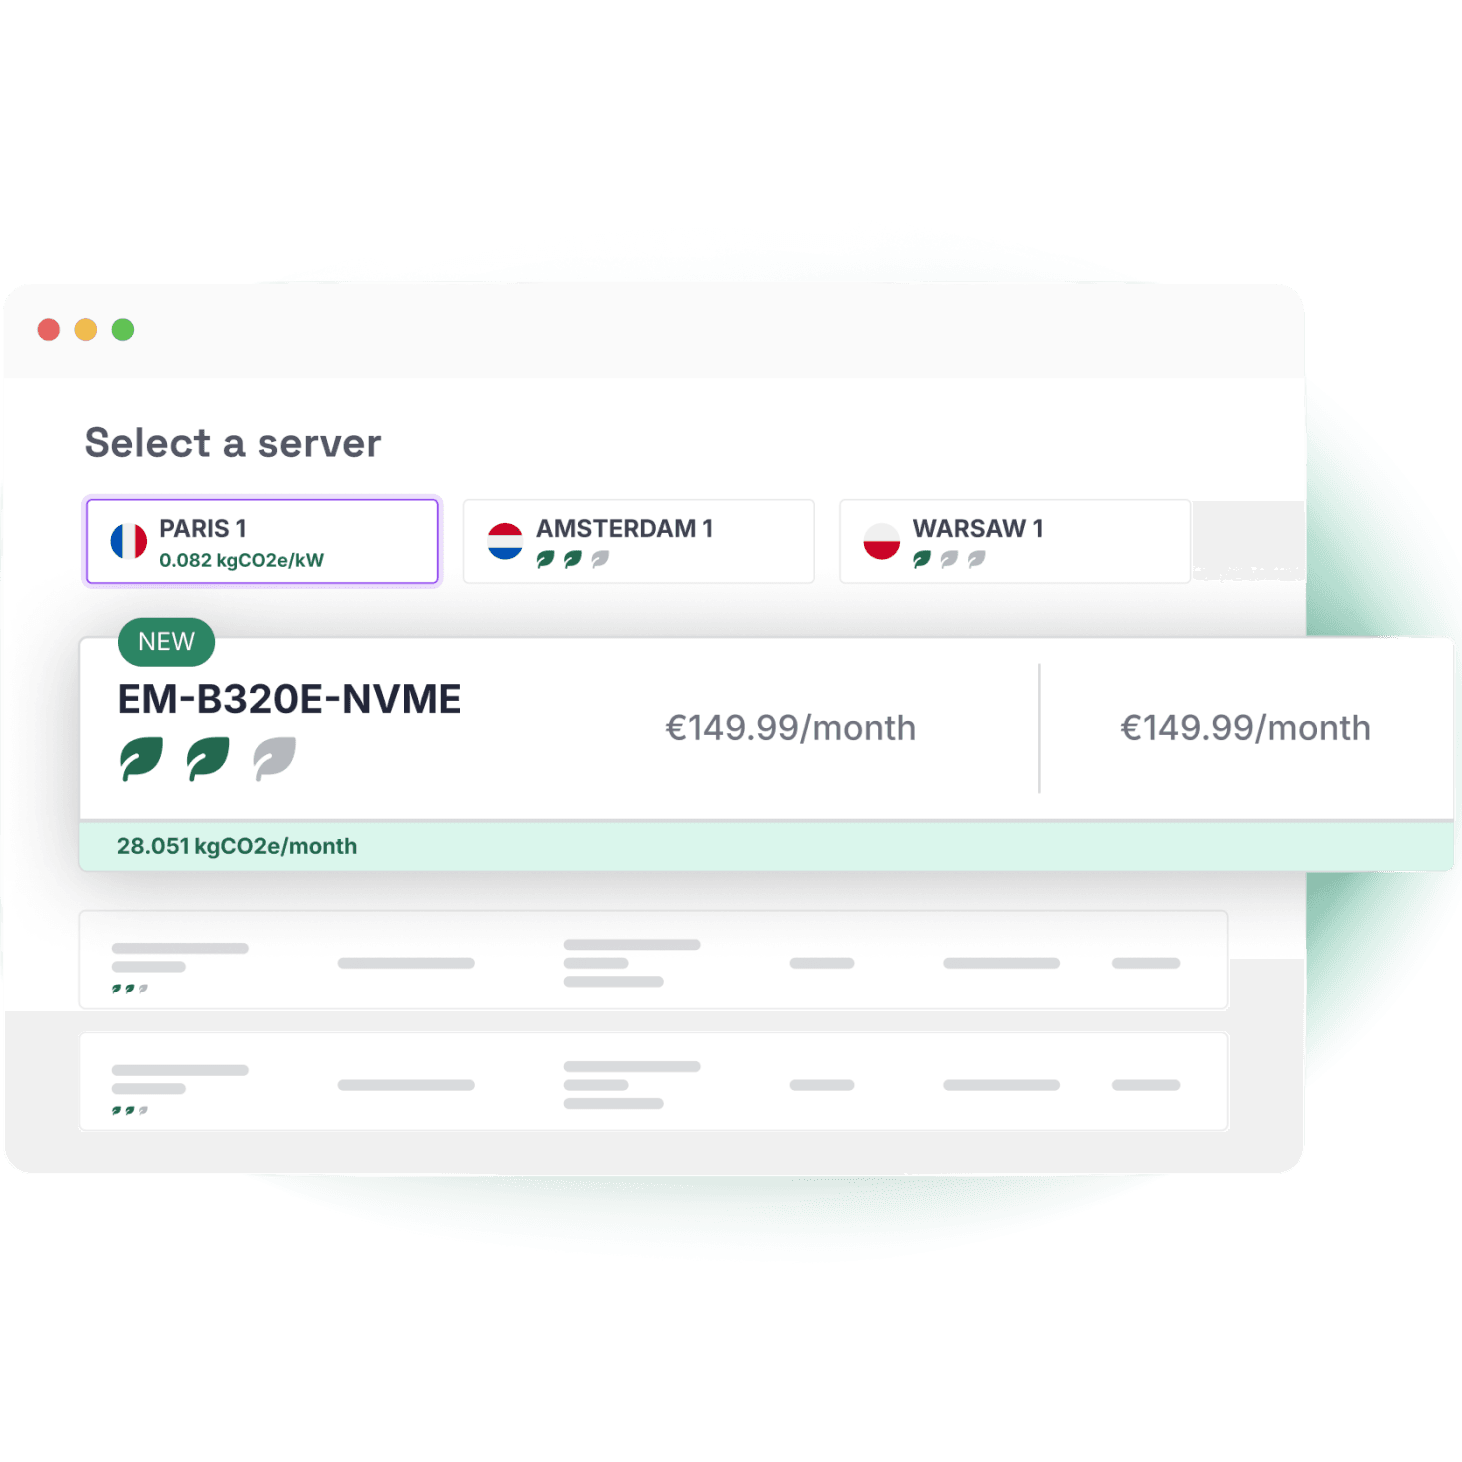
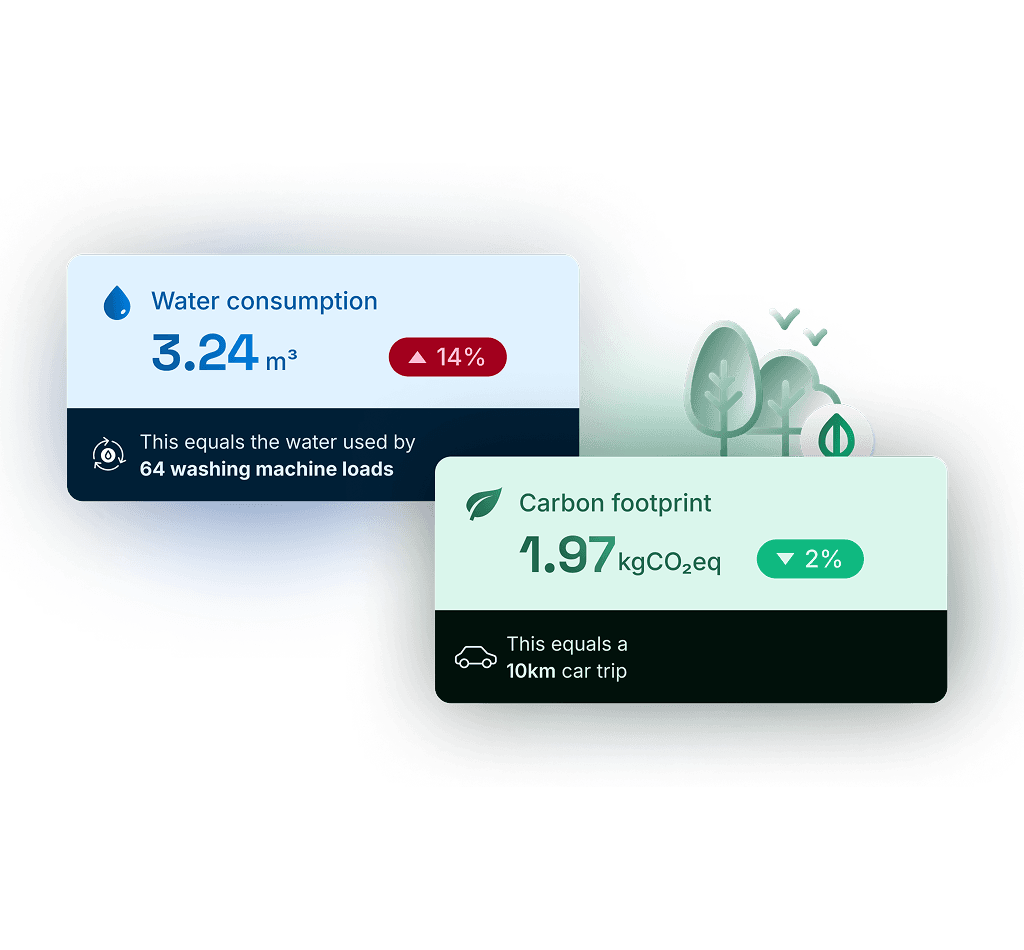
Monitor real usage — not estimates

Access accurate, daily-updated data on your cloud footprint, broken down by product, region, and project. Not generalized averages but real, granular metrics (e.g., carbon emissions in kgCO₂e and water usage in m³ of water) based on your actual usage. View your impact via monthly reports or integrate it directly into your systems via API.

Design lower-impact infrastructure

Use impact estimates available directly in the console to guide your architectural choices. Compare cloud products within a family using key indicators (like kgCO₂e/hr) and an easy-to-read 0-to-3 leaf scale, helping you align performance with sustainability goals.

Communicate with clarity and credibility

Easily share your footprint with internal and external stakeholders using data backed by a transparent methodology co-developed with ADEME. Whether it's a shareable PDF for your CSR team or daily metrics via API for dashboards and GreenOps tools, the calculator helps you embed sustainability into your business strategy.

The Sustainability Challenge

Digital footprint keeps growing

According to International Banker, the total power consumed by data centres will rise to more than 1,000TWh by 2026, roughly equivalent to Japan’s electricity consumption.

Monitoring and comparability are limited

Calculating a digital product's footprint is complex, involving multiple lifecycle stages. The absence of a universal calculation method makes provider comparisons challenging.

Regulations are around the corner

The EU’s Corporate Sustainability Reporting European Directive (CSRD) mandates annual environmental impact reporting by 2025 for large companies and 2027 for smaller ones.

Discover your real Environmental footprint

  • Carbon and water metrics

    Access detailed, lifecycle-based data on the carbon footprint and water consumption of your infrastructure. Metrics are updated daily, allowing you to track changes over time, assess the impact of your technical decisions, and support your sustainability reporting with reliable, actionable insights.

  • Clear, comparable data to guide your choices

    All products within the same family are evaluated using a consistent methodology, so you can compare them on equal footing. Use metrics like kgCO₂e/hr and a 0-to-3 leaf scale to assess their footprint. Not satisfied with the impact? Try a different reference, or switch regions to see how it changes. Sustainability starts with informed decisions.

  • Based on a methodology co-built with IJO & ADEME

    We partnered with IJO, a specialist in responsible digital practices, to develop the most thorough methodology possible. Our calculations are based on ADEME’s Product Category Rules (PCR), an industry standard that ensures reliable and consistent measurements. This approach covers the entire lifecycle impact, from server manufacturing to their use in our data centers.

Product scope

The Environmental Footprint Calculator is designed to provide a comprehensive view of the environmental impact of your cloud usage. We are progressively integrating all products from our ecosystem into the unified tracking system of the calculator. Find below, the list of currently supported products and the available data for each.

ProductsMonthly reportsEstimationsData via API
Elastic Metal
Apple Silicon
CPU Instances
Block Storage & Object Storage🏗️
Dedibox🏗️🏗️
Legal notice

Monthly reports summarizes the environmental impact of each specific product.
Estimations are impact estimates expressed in kgCO2/hr, visible directly in the console to help guide your infrastructure choices.
Data via API is the API access to integrate environmental data into your internal dashboards and sustainability strategies.

Get started with tutorials

Environmental impact resources

Discover your environmental impact

Frequently asked questions

Will environmental impact data be provided for all Scaleway products?

Yes, we will proceed product by product so that, in time, you will have access to environmental impact information for each of the products you use.

What are the limits of the calculator?

We miss a lot of supplier data.
It can sometimes be challenging to obtain all the necessary data from our suppliers, both for hardware manufacturing and data centers. In such cases, we use estimates with the support of Boavizta and ADEME's database.

Why do you talk about a holistic approach?

The methodology we use is taking into account as many criteria as possible to get an image of the impact produced but also left in the ecosystem.
Thus the calculator takes into account:

  • Scope 3:
    The majority of emissions generated by Cloud consumption are in Scope 3!
    Based on GCP Impact report from 2023,
    Scope 1 emissions represent 1%of the total emissions
    Scope 2 emissions represent 24%of the total emissions
    Scope 3 = 75%of total emissions!
    Not measuring Scope 3 would completely miscalculate your carbon footprint.

  • LCA:
    Life Cycle Assessment (LCA) quantifies the emissions produced at each phase of the product or service’s life cycle, from its design to its end of life and its impact on natural resources, ecosystems, etc.
    Following a LCA Methodology, like the The Datacenter and Cloud PCR does, is moving from a subjective calculation based on a company operations’ and value chain’s emission to a holistic approach quantifying impact of the life cycle of a product and a service on the environment around it.

  • Water:
    Frequently ignored in cloud reporting, water is a major element of IT's impact on the planet. All the more so, generative AI/LLMs consume considerable amounts of water (cf. ChatGPT convo = 0.5 liters), and AI adoption is growing very fast.
    When assessing cloud providers, Power Usage Effectiveness (PUE) is often highlighted. A PUE close to 1 indicates better energy efficiency. However, a strong PUE can sometimes mask a less efficient Water Usage Effectiveness (WUE). For a realistic view of a data center’s environmental footprint, it’s essential to consider both metrics and that is why we provide transparent insights on consumption based on the Water Usage Efficiency (WUE) of our data centers.